

Network Documentation, Diagramming, & Visuals
Starting part-time in March 2026 offering Creative Consultancy, I was surprised where most of my inquiries came from. Working remotely I am now offering Network Documentation and Diagramming services internationally, transforming complex network data, configurations, and raw system information into clear, professional infrastructure diagrams and asset schedules.
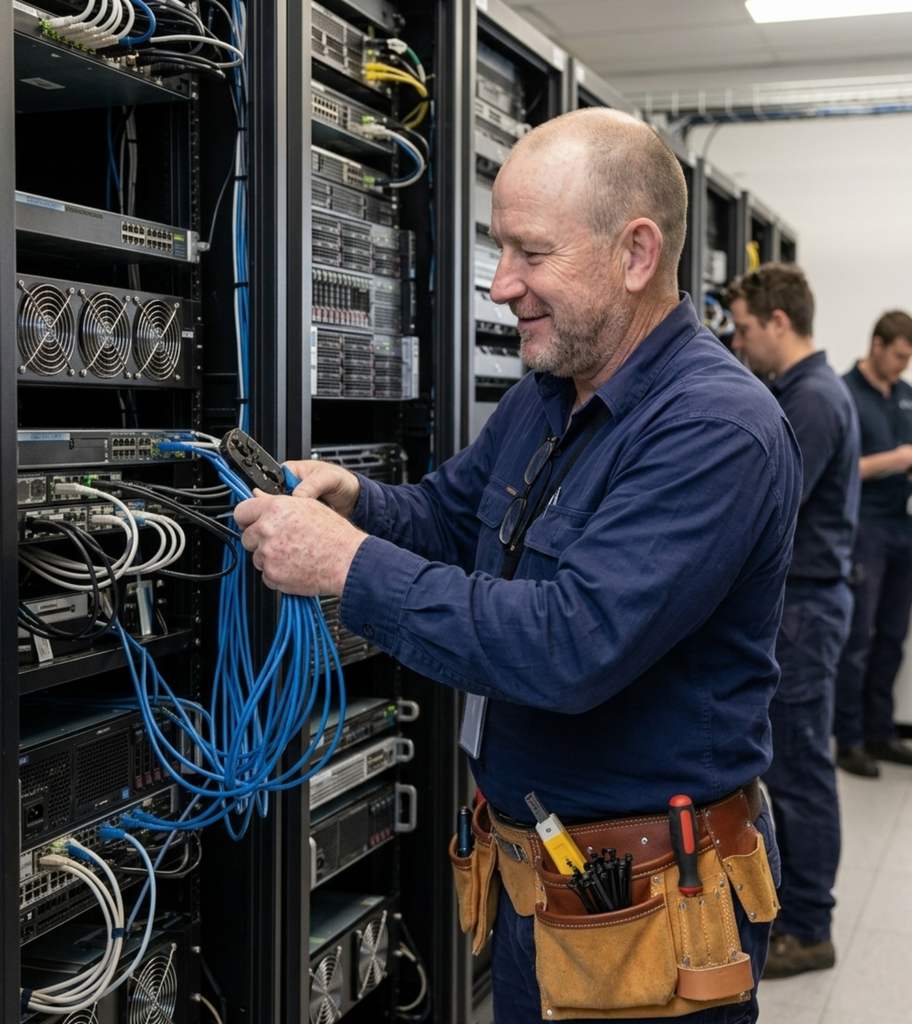
From LAN and WAN topologies and server racks to data centres, telecommunications, and building systems, I turn scattered technical inputs into structured visual maps and reference documentation.I understand what it is like to trace a fault, install cabling, work inside a communications rack, and follow connections through an unfamiliar environment, because I have done that work myself. I remember my time on the tools and the pressure of resolving faults or completing installations when the documentation was incomplete, outdated, or missing.
I did not particularly enjoy the paperwork, but I learned how valuable it became when someone later needed to understand, troubleshoot, or change the system. That experience is why I do this work now: I create the documentation I would have valued having in the field.Today, I work alongside the engineers, technicians, MSPs, contractors, and system owners who provide and verify the authoritative technical data.
My approach is practical and methodical: understand the environment, audit and organise the available information, make uncertainties visible, and present the system clearly so teams can confidently maintain, use, and hand it over.
Network Documentation for Connected Environments

Logical Network & Topology Diagrams
High-clarity visual diagrams that translate dense routing, switching, and security configurations into intuitive, scannable maps.
This may include:
• Logical L2/L3 network topology diagrams
• VLAN, subnet, and routing visualisations
• Firewall routing and security zone logic
• Internet (ISP) circuit and failover paths
• Remote access (VPN), cloud, and site-to-site topologies
• Data flow and traffic bottleneck visualisations
• Simplified overview diagrams for non-technical stakeholders
The goal is to give technical teams and stakeholders an instant, accurate view of how data flows across core infrastructure, reducing outage downtime and eliminating reliance on undocumented “tribal knowledge.”

Physical Rack, Cabling & Site Maps
High-clarity visual diagrams that translate dense routing, switching, and security configurations into intuitive, scannable maps.
This may include:
• Logical L2/L3 network topology diagrams
• VLAN, subnet, and routing visualisations
• Firewall routing and security zone logic
• Internet (ISP) circuit and failover paths
• Remote access (VPN), cloud, and site-to-site topologies
• Data flow and traffic bottleneck visualisations
• Simplified overview diagrams for non-technical stakeholders
The goal is to give technical teams and stakeholders an instant, accurate view of how data flows across core infrastructure, reducing outage downtime and eliminating reliance on undocumented “tribal knowledge.”

Network Data Schedules & Asset Registries
Structured technical tables and configuration schedules captured during the diagramming process to serve as your single source of truth.
This may include:
• IP address management (IPAM) schedules and subnet tracking
• VLAN schedules and port allocation tables
• Network asset registries (makes, models, serials, and locations)
• MAC address mapping and DHCP reservation lists
• Server, storage, and network-attached peripheral inventories
• Core router/switch configuration records and operational runbooks
By organising the raw data behind your diagrams, you eliminate network blind spots and maintain a reliable reference of what is connected to your network, where it lives, and what it does.
Physical Infrastructure Labelling & Identification
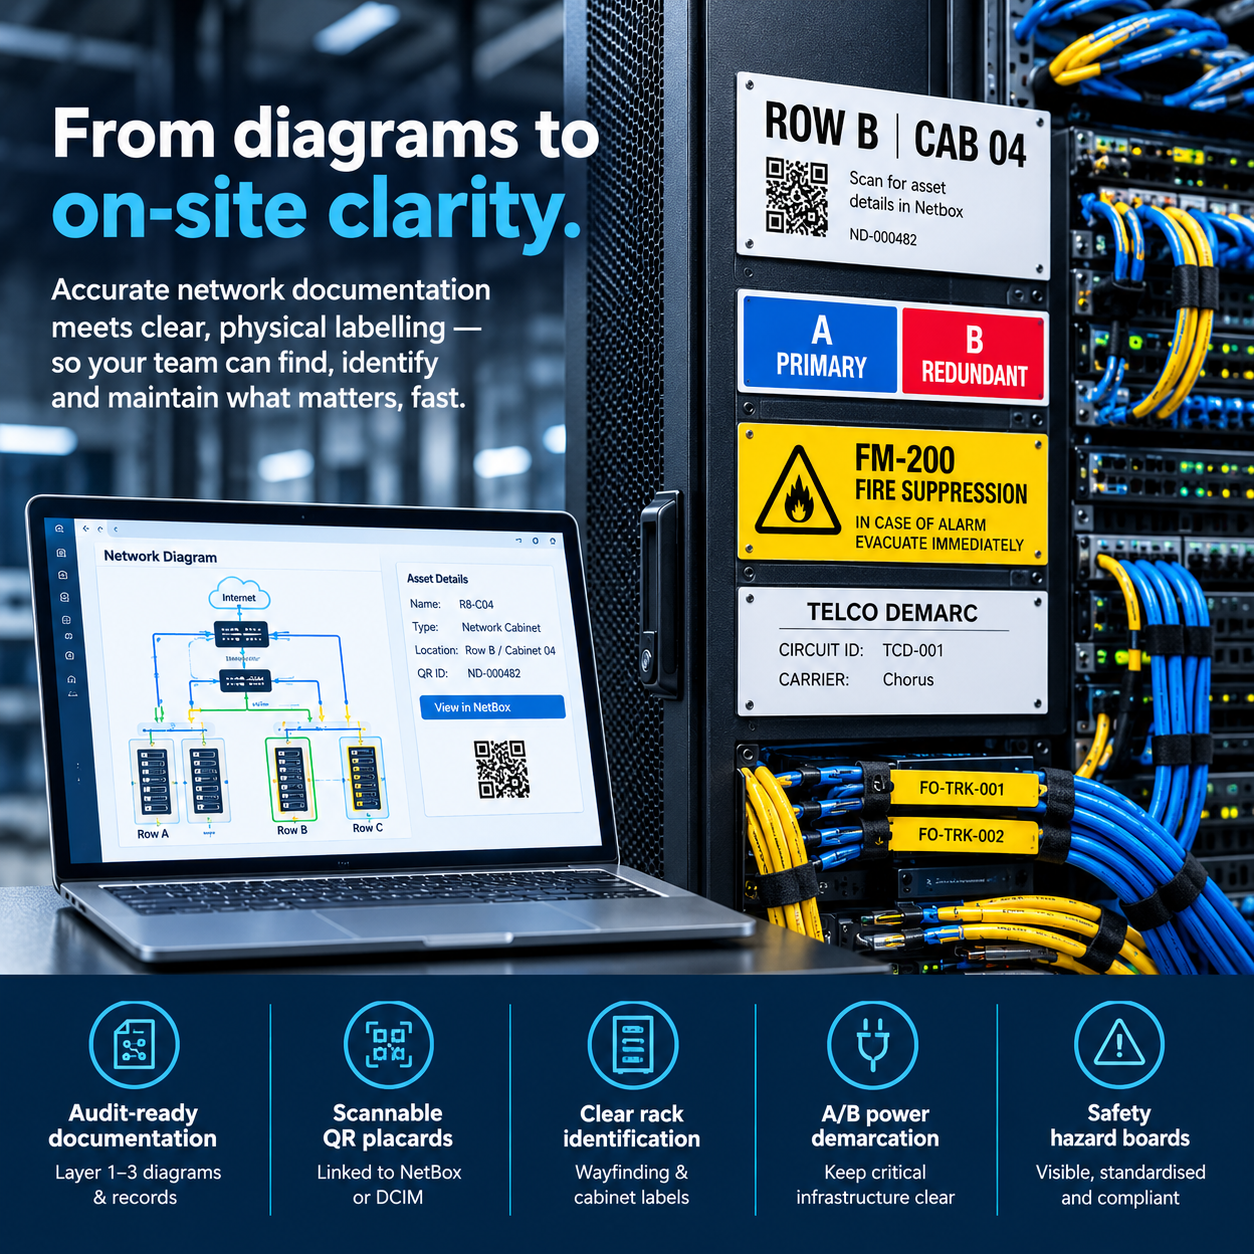
Accurate network documentation shouldn’t stop at the screen. I bridge the gap between digital network architecture and physical server rooms with custom infrastructure signage, rack wayfinding, and industrial labeling systems.
From high-contrast cabinet identification and scannable QR placards linked directly to your NetBox or DCIM records, to A/B power feed demarcation and clear safety hazard boards, every asset is designed to eliminate guesswork where split-second maintenance decisions happen.
By pairing audit-ready Layer 1–3 documentation with intuitive, standardised physical visual cues, your engineering and facilities teams gain complete operational clarity. The result is faster on-site troubleshooting, frictionless onboarding for contractors, streamlined compliance audits (ISO 27001/SOC 2), and a significant reduction in the costly human errors that cause physical downtime.

James Price
I provide independent network diagramming and technical documentation services, specialising in visualising complex IT and infrastructure environments.
My background combines hands-on expertise in ICT and networking with formal qualifications in creative design and adult education. This dual lens allows me to master complex technical concepts, design intuitive information structures, and communicate them effortlessly to both technical experts and everyday users.
Credentials & Qualifications
• Cisco Network Studies
• Cisco Cybersecurity Studies
• Certificate in Information Systems & Technology
• National Diploma in Design (Graphic) – Level 5
• NZ Diploma in Digital Media & Design – Level 5
• Diploma of Art & Creativity (Advanced) – Level 7
• NZ Diploma in Creativity – Level 6
• Nat Dip in Adult Education – Level 5
• Diploma in Business
Technology environments become complex quickly. Critical infrastructure data is often scattered across outdated drawings, equipment lists, configuration records, spreadsheets, rack photos, and the tribal knowledge held by individual technicians. Clear network diagrams and structured documentation bring that information together.
I help organisations consolidate raw technical data into accurate, visual infrastructure diagrams and supporting reference documentation.